As OAP’s set to rise to 1 in 3 of Thornton-Cleveleys’s population by 2037 – Where are they all going to live?

With constant advances in technology, medicine and lifestyles, people in the Thornton-Cleveleys area are, on average, living longer than they might have a few decades ago. As Thornton-Cleveleys’s population ages, the problem of how the older generation are accommodated is starting to emerge. We, as an area, have to consider how we supply decent and appropriate accommodation for Thornton-Cleveleys’s growing older generation’s accommodation needs while still offering a lifestyle that is both modern and desirable.

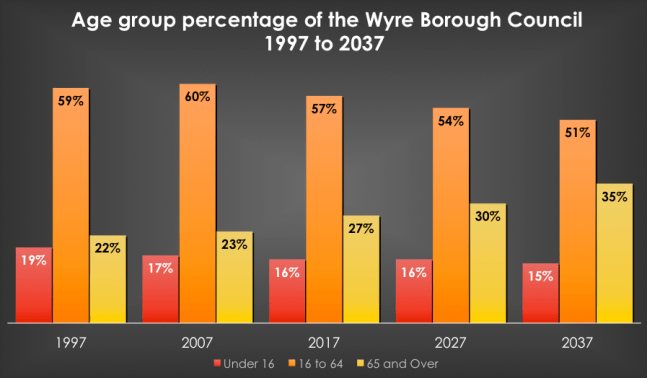
In 1997 in Thornton-Cleveleys, around one in every five people (22%) were aged 65 years and over (and the local authority area as a whole), increasing to over one in every four people (27%) in 2017 and it is projected to reach more than one in every three people (35%) by 2037, meaning..

Over the next 19 years, the growth of the over 65 population in Thornton-Cleveleys will grow by 29.6% – a lot more than the overall growth population of Thornton-Cleveleys of 5.2% over the same time frame.

In fact, the number of those over 90 is expected to more than double in our local authority from 1,426 (1.3%) in 2017 to 2,947 (2.5%) by 2037.

image001

And looking at the proportional percentage changes over those years…

Age group percentage of the Wyre Borough Council  1997 to 2017 and 2017 to 2037
  Percentage Change from 1997 to 2017 Percentage Change from 2017 to 2037
Under 16 -15.79% -6.25%
16 to 64 -3.39% -10.53%
65 and Over 22.73% 29.63%

Looking at Thornton-Cleveleys and the local authority as a whole, there is a distinct under supply of bungalows and retirement living (i.e. sheltered) accommodation. The majority of sheltered accommodation fit for retirement is in the ex-local authority sector whilst the majority of private sector bungalows were built in the 1960s/70s/80s and are beginning to show their age (although that means there is often an opportunity for Thornton-Cleveleys investors and Thornton-Cleveleys buy to let landlords to buy a tired bungalow, do it up and flip it/rent it out).

In the medium to longer term, we need to build more bungalows and sheltered accommodation and, if we do that, that won’t only be of benefit to the elderly population of Thornton-Cleveleys – it will have a direct knock-on effect to the younger and middle-aged population by unlocking those family homes the older generation homeowners live in.

There have been 17 Housing Ministers since 1997. No one ever seems to stay in the job long enough to create a consensus and direction in Government Policy on the vital issue of the country’s housing shortage, yet the sound bites and White Papers seem only to focus exclusively on first-time buyers when there is an even more severe and disregarded shortage in suitable housing for the older generation.

This scantiness affects both mature homeowners trapped in unsuitably big family properties, unable to find smaller bungalows or suitable retirement apartments, whilst the waiting list for Council sheltered accommodation is putting a strain on other aspects of social care. In both circumstances, policy coming (or not coming) out of Government is repressing the supply and type of accommodation mature people desire, need and want, whilst at the same time, increasing the cost (and taxes) for social and NHS care.

Maybe we need tax breaks for people to downsize or planning permissions that stipulate bungalows only. Whichever way you look .. there are challenging times ahead for us all.

Blackpool ‘Home Owning’ Movers and Shakers in 2018

It’s now commonly agreed amongst economists and the general public that the dramatic rise in Blackpool property prices of the last six years has come to an end.

Read the National newspapers, and they talk of doom and gloom in the British housing market with such things as strained buyer affordability (as property prices have increased over the past six years at a far faster pace than average salaries), a lack of new properties being built and the Brexit uncertainties over the last two and half years being blamed for the slow down – yet in the last 12 months, people have still been moving, buying and selling in Blackpool at levels similar to the last six years – something tells me we have a case of ‘bad news selling newspapers’.

So instead, let me share with you what, exactly, is happening in the Blackpool property market, and more specifically, who is moving and why in Blackpool.The majority of sales in Blackpool during the last twelve months were semi-detached properties, selling for an average price of £129,200. Terraced properties sold for an average of £92,400, with detached properties fetching £226,800.

In Blackpool, in the homeowner sector in 2018 (i.e. owner occupation), 625 households moved within the tenure (i.e. sold the home they owned and bought another one) and 122 new households were created (i.e. they moved from living with family/friends and bought their first home without privately renting).

image001

What does this mean for Blackpool buy to let landlords? Well looking at the graph, it appears bad news for landlords. There were 291 households that moved into the home owning (owner occupation) tenure from the private rented sector, whilst on the other side of the coin, 229 Blackpool households moved to the private rented sector from owner occupation … which appears on the face of it, a reduction in the private sector.

My research has calculated that in 2018, an additional 303 new households in the Blackpool private rental sector were created

…and it will continue to grow at those levels for the foreseeable future.

I have one final thought and opportunity for you Blackpool property investors. 271514 owner occupied households in Blackpool sold in last year where the homeowners had passed away. These properties can be a potential goldmine and offer great returns. The reason being is some members of the older generation who have owned these homes for decades have spent money on high capital items (double glazing / central heating etc.) but not spent money on more superficial low-ticket items such as up to date carpets, kitchen, bathroom and decorating (vital if you want to sell your property for top dollar). These properties can often be bought cheaply because most buyers can’t see past the avocado or brown bathroom suite from the 1970’s and the dated decor, so if you were to buy wisely and do the works, you could sell it on for a healthy profit.

So, whatever is happening in the world with Brexit, Trump, China, and the Stock Market … the Blackpool housing market is in decent shape for the medium to long term. If we do have small corrections in values in the next 12 to 18 months, in the long term, house prices have always returned … and returned with vengeance. Like I say to anyone buying a property, be they a first time buyer, landlord or homeowner … property is a long game … and if you play the long game, you will always win (although isn’t that true in most aspects of life?).

Top 25 Most Saleable Streets in Bispham

Following on from my last article, if you recall I said that Queens Promenade had the most properties sold in the FY2 Blackpool postcode, yet I felt that this information wasn’t telling the whole story, as some roads in Blackpool have more properties on them than others. Therefore, I promised that I would compare the average number of properties sold by the actual number of properties on that street, to find out the streets whose owners proportionally moved (or sold) more often than the rest of the locality.

To give some foundation to the article, in 2017 Blackpool homeowners had, on average, lived at their existing address for 17 years and 6 months. However, when I looked at the difference between homeowners with and without a mortgage; Blackpool homeowners without a mortgage had lived in their Blackpool home for an average of 23 years and 9 months compared with 10 years and 1 month for homeowners with a mortgage. Interestingly, Blackpool’s Council house tenants have on average resided at their present home for 11 years and 4 months, whilst finally for those who rent from a private landlord, tenants generally have lived in their property for an average of 3 years and 11 months (up from 3 years 5 months only five years ago).

The FY2 street in the top 25 saleable streets with the highest number of households on it is Queens Promenade, which has 434 residential addresses. Yet since 1995, only 602 properties have changed hands (some multiple times!)  .. which means the street’s saleability or churn rate is 138.7%.

However, the street or road that has the highest saleability or churn rate is Coriander Close … which has 51 households on it, yet since 1995 there have been 108 house sales … a saleability rate of 211.8%. Here is the full breakdown of the top 25 streets …

image001Screenshot 2018-11-24 19.33.19

So, as you can see, some interesting statistics and a lot more correlation between saleability rate and property values (unlike the article last time where we compared value to ‘out and out’ raw sales figures).

Therefore, what does this all mean to Blackpool homeowners and Blackpool landlords?  Well these 25 streets are the best performing streets out of the 258 streets in the Blackpool (FY2) area so if you live/own a property on those 25 streets … you are sitting on a very saleable street. If you want to find out how saleable your street is .. please drop me a line and we can discuss this further.

Queens Promenade, Blackpool… …the road where people move the most

Many folks say moving home is the most stressful thing. Moving home is like someone (and that someone is usually you and you are the cause of this devastation) has collected all your worldly goods, put them into brown boxes and into a lorry making your whole life look like a Amazon delivery van, only to spend the next six months unpacking it all, whilst unable to find important things like your bank cards, ‘those’ shoes or special jewellery.

We wish we could be instantly transported like in Star Trek “Beam me up Scotty to a blissful moved in state”. Yet the week you move, it’s like an episode from the original 1960’s series Star Trek, when the crew had a transporter accident with an ion-storm sends Kirk and Spock into an alternate reality, where the caring Federation is the merciless Terran Empire, and the USS Enterprise is a warship and chaos eschews!!!

Star Trek aside, when you decide to move and before the stress of living out of cardboard boxes for months descends; first you trawl the portals (Rightmove/Zoopla/On The Market) to find a new house, which out of the hundreds of properties available to buy, you will probably only view around four or five of them, for no more than 20 minutes each. Then, you will arrange a second viewing of one or two of those initially viewed properties for the estate agency industry stated average of 30/45 minutes maximum (fascinating when you think most people take hours to decide what clothes or shoes to buy but minutes to spend hundreds of thousands of pounds on their next home!).  Then you put your property on the market with an estate agent, find a buyer for your Blackpool property, agree a price for both, then instruct solicitors. The property becomes sold ‘subject to euphuism’ … sorry ‘contract’ … as solicitors and surveyors and mortgage companies pick holes in the paperwork, threatening to wreck the chain at any moment, whilst you can’t get too attached to the property you want to purchase in case the sale falls through … phew – stressful or what??!!

Is it worth it? Worth the stress? The brown cardboard boxes? Well many Blackpool people think so.

In the last 12 months, 294 families have sold and moved home in Blackpool (FY2)

Yet the question I want raise is … do people on certain streets in the FY2 postcode move more often than others? Well, the answer might surprise you. I looked at the Land Registry for the all the property sales going back 23 years (to 1995) in the FY2 postcode whilst also calculating the average value of a property on a particular street/road (to see if there was a correlation between price and moving). So initially looking at the top 10 streets in the postcode, in terms of pure out and out house sales, Queens Promenade is the winner with an average of 26.17 house sales per year(since 1995) as on the graph below.

image001

And to look at the bigger picture, the table below shows the top 25 streets, with the average value of a property on that street.  As you can see, there is no correlation between the average value of a property and the number of times a property gets sold on that street.

Screenshot 2018-11-24 19.18.31.png

However, I still felt the information wasn’t telling the whole story … some roads in Blackpool have many more properties on than others, so I wanted to then compare the average number of properties sold by the actual number of properties on that street, to find out the streets whose owners proportionally moved (or sold more often) than the rest of the locality.

In the next article, (and I promise I won’t mention Star Trek again), I will answer that question in great depth … and the results should (as they did me) certainly raise an eyebrow. The question is … do you live on one the top 25 Blackpool most saleable streets in Blackpool (FY2)?

Come back to my Blackpool Property Blog for the next article to find out!

Blackpool Property Values 3.3% higher than year ago – What’s the PLAN to fix the Blackpool Property Market?


It’s been nearly 24 months since Sajid Javid, the Tory Government’s Housing Minister published the White Paper “Fixing the Broken UK Housing Market”, meanwhile Blackpool property values continue to rise at 3.3% (year on year for the council area) and the number of new homes being constructed locally bumps along at a snail’s pace, creating a potential perfect storm for those looking to buy and sell.

The White Paper is important for the UK and Blackpool people, as it will ensure we have long-term stability and longevity in property market as whole. Blackpool home-owners and Blackpool landlords need to be aware of these issues in the report to ensure they don’t lose out and ensure the local housing market is fit for purpose. The White Paper wanted more homes to be built in the next couple of decades, so it might seem counter-intuitive for existing home-owners and landlords to encourage more homes to be built and a change in the direction of housing provision – as this would appear to have a negative effect on their own property.

Yet the country needs a diversified and fluid property market to allow the economy as whole to grow and flourish … which in turn will be a greater influence on whether prices go up or down in the long term. I am sure every homeowner or landlord in Blackpool doesn’t want another housing crisis like we had in 1974, 1988 and most recently in 2008.

Now, as Sajid Javid has moved on to the Home Secretary role, the 17th Housing Minister in 20 years (poisoned chalice or journeyman’s cabinet post) James Brokenshire has been given the task of making this White Paper come alive. The White Paper had a well-defined notion of what the issues were.

The first of the four points brought up was to give local authorities powers to speed up house building and ensure developers complete new homes on time. Secondly, statutory methods demanding local authorities and builders build at higher densities (i.e. more houses per hectare) where appropriate. The other two points were incentives for smaller builders to take a larger share of the new homes market and help for people renting.

However, lets go back to the two initial points of planning and density.

(1) Planning

For planning to work, we need a robust Planning Dept. Looking at data from the Local Government’s Association, in Blackpool, the council is below the regional average, only spending £24.94 per person for the Planning Authority, compared the regional average of £36.11 per head – which will mean the planning department will be hard pressed to meet those targets.

However, 100% of planning applications are decided within the statutory 8-week initial period, above the regional average of 86% (see the graph below).  I am slightly disappointed and also pleased with the numbers for our local authority when it comes to the planning and the budget allowed by our Politician to this vital service.